top of page

Quick Look
In our project, I worked as a research assistant, collaborating with the professor and my co-workers on various tasks. My responsibilities included assisting with code handling, data cleaning using Excel and OpenRefine, brainstorming storytelling ideas, and contributing to the creation of dynamic maps and networks using Gephi.
Throughout the project, we conducted thorough data scanning and cleaning to ensure accuracy and eliminate inconsistencies. I actively participated in this process, utilizing Excel and OpenRefine to refine the dataset.
In addition, I contributed to the exploration of narratives within the apprenticeship records. By analyzing the relationships between masters, apprentices, and other individuals, we gained valuable insights into the social dynamics of London's brewing industry during that time.
To visually present our findings, I collaborated with colleagues to develop dynamic maps illustrating the spatial distribution of apprenticeship networks. By utilizing mapping tools and GIS, we created engaging visual representations of the brewing community's connections and geographical spread.
Furthermore, I played a key role in constructing networks using Gephi. This network analysis helped us understand the social structure and dynamics of the brewing generation, identifying important nodes, clusters, and influential individuals.
In summary, my involvement in the project encompassed various responsibilities, including data cleaning, code handling, storytelling, and data visualization. Through this research, we gained insights into the historical apprenticeship networks of London brewers, utilizing social network analysis techniques to uncover hidden stories from the past.
Data Cleaning
Storytelling
Dataviz
Dealing with
Data
I gained significant proficiency in data processing using tools like Excel through this project.
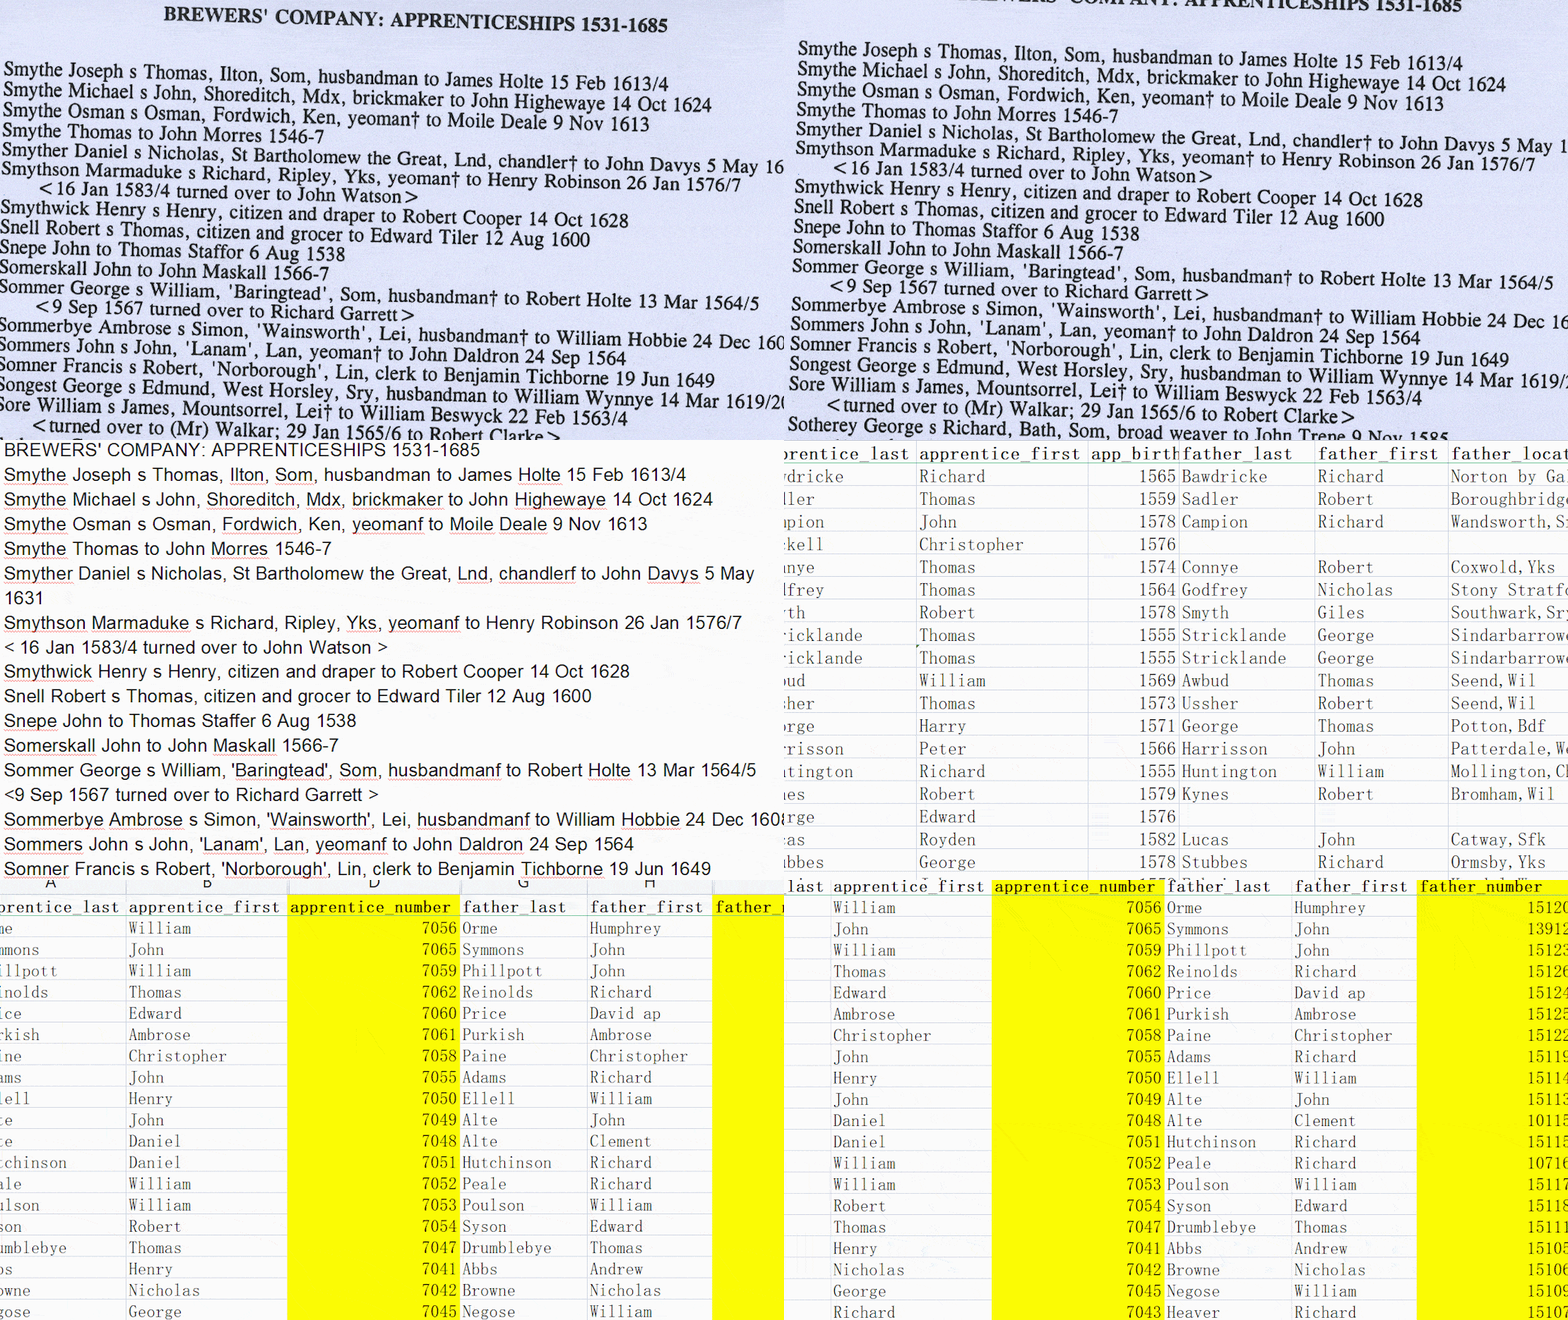
To start with, we acquired a book containing apprenticeship information from 1530 to 1800. We performed OCR scanning on all the pages and began the process of data cleaning. The word text underwent meticulous scrutiny, and we manually corrected notable errors. After ensuring consistency in spelling and other aspects with the original book, we utilized Python to populate a spreadsheet with numerous data columns. Continuously optimizing our code, we aimed to encompass as much of the original data as possible within the database.
Subsequently, we proceeded to clean the data. Using in-built functions of Excel and OpenRefine, we reallocated incorrectly assigned data and eliminated invalid entries.
Furthermore, we assigned unique identifiers to each character. Each individual, whether a father, apprentice, or master, was assigned a distinct identification number. This facilitated the subsequent establishment of networks among the individuals, making it easier to analyze the relationships and connections between them.


Click on this link to access the cleaned spreadsheet file
Digging out Insights
Furthermore, I made a significant contribution to the information and presentation of the final report by leveraging my knowledge and experience in the field of new media.
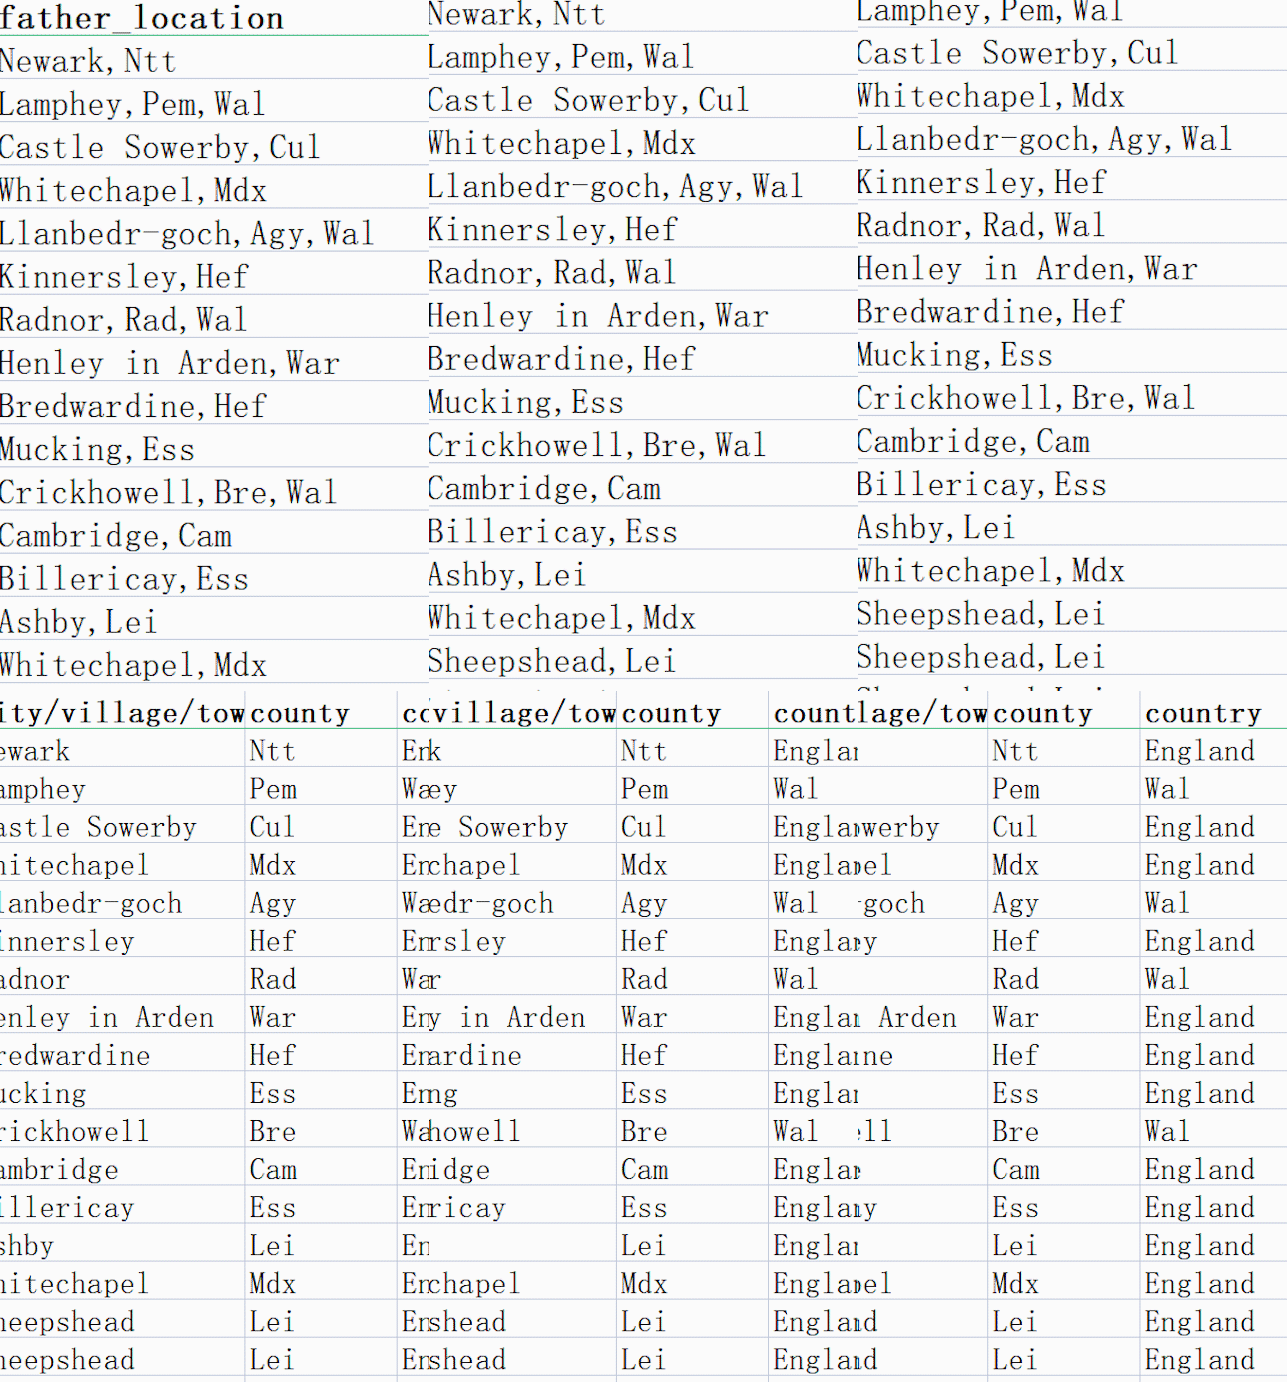
During the data cleaning process, I paid particular attention to the "location" data column, which indicated the origins of the apprentices. To uncover potentially interesting insights in the distribution of locations, I categorized the complex location data into street, town, city, and region. I then extracted all relevant rows from the location column and limited the analysis to the UK region.

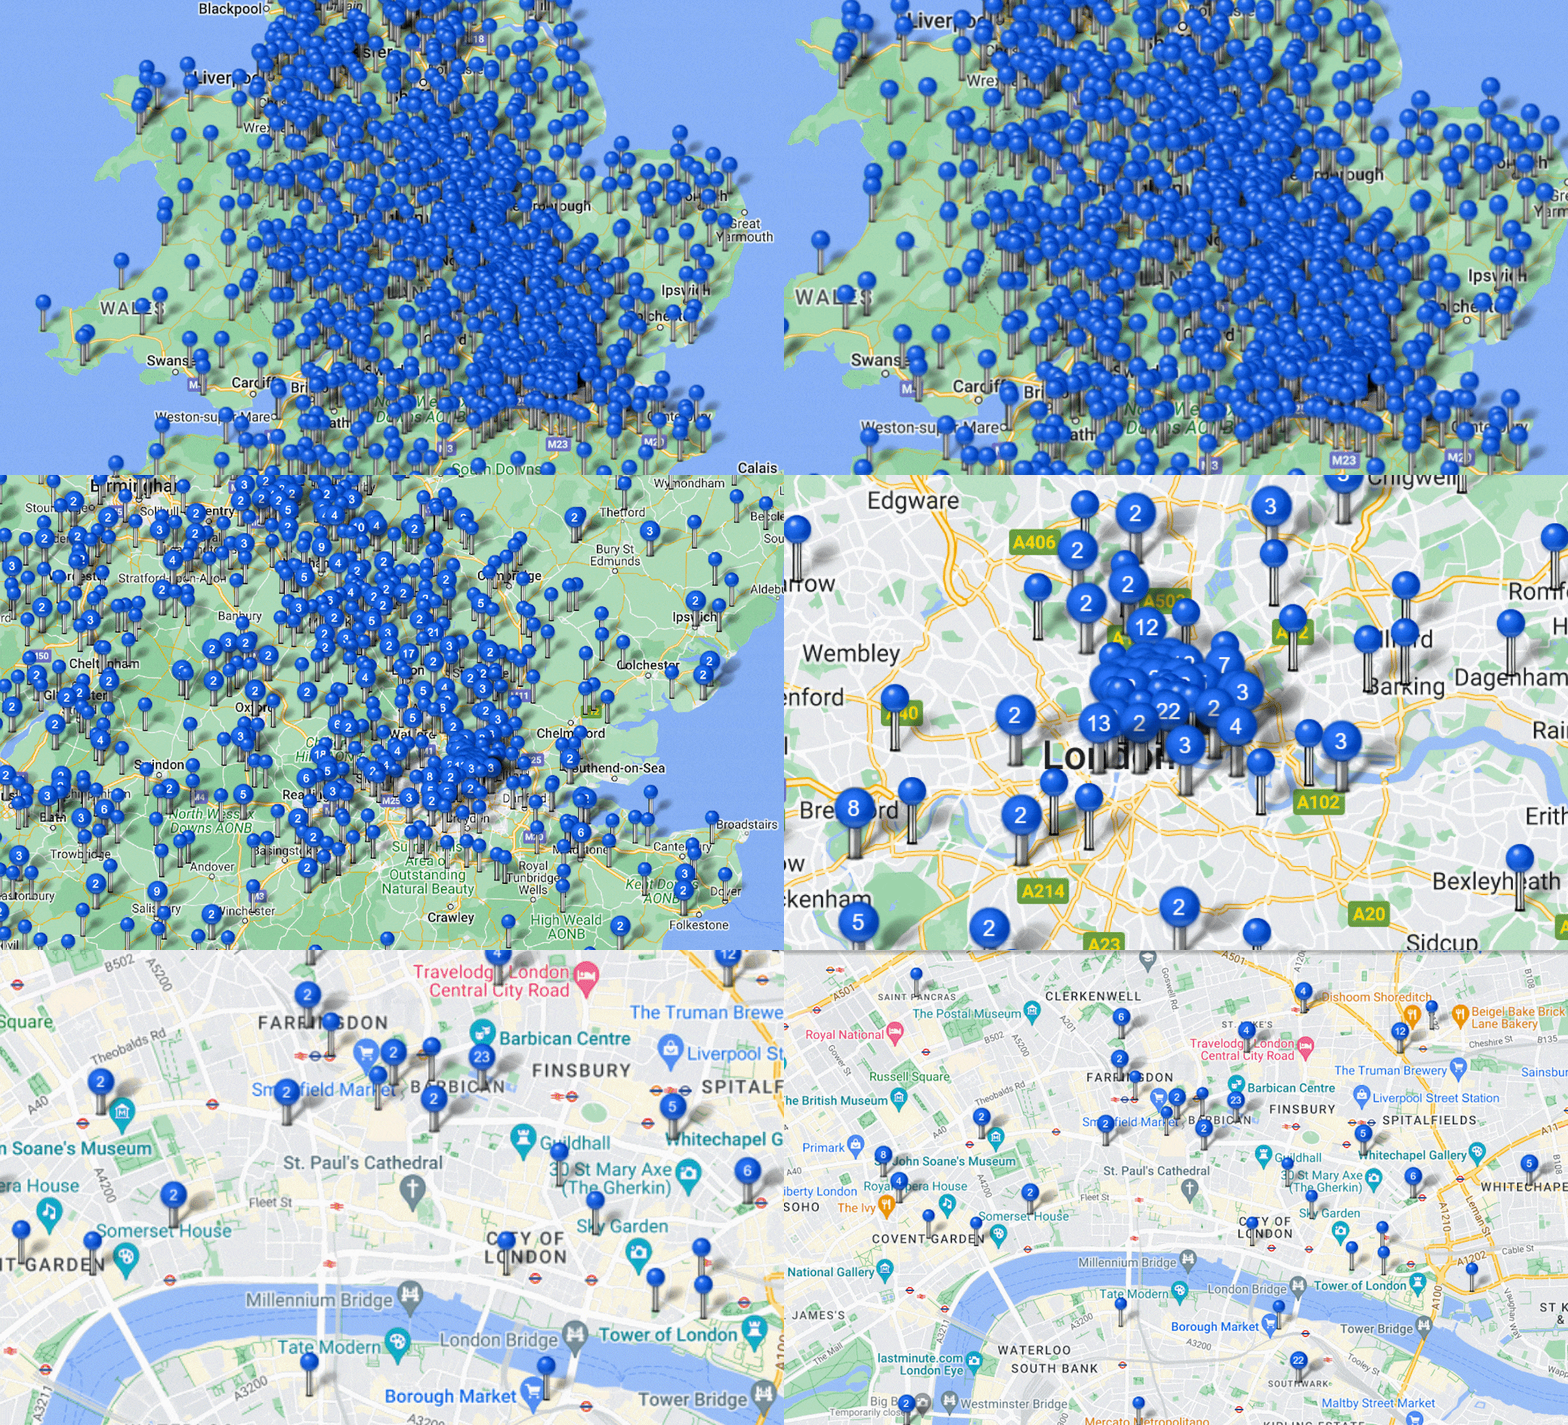
Using the Maptive mapping platform, I imported the data and proposed two types of maps: a Heat Map and a Pin Map. The Heat Map showcased the variation in popularity among different regions (e.g., Greater London being the most popular). And the Pin Map provided a detailed view of the distribution within specific regions (e.g., a particular church in London). The visualization of the final maps was particularly captivating. The Pin Map, with its interactive features, allowed users to click on each pin and access specific apprenticeship information associated with it, such as the apprentice's name, father's name, and other relevant details.


In addition to the geographical analysis, I also observed the intergenerational dynamics within the apprenticeship relationships—where some apprentices eventually became masters and took on their own apprentices. This provided an excellent opportunity to demonstrate the social network using Gephi. Working alongside the professor, we used Python code to identify all relevant data points that matched this criterion and imported them into Gephi to visualize the intergenerational relationship network.

Presentation at Congress 2023
Finally, this research project was accepted to be presented at the 2023 Congress of the Humanities and Social Sciences held at the York University. My professor prepared the report and created a slideshow, and we assisted in its completion.


During the congress, I delivered a presentation on the mapping aspect, explaining to the audience why we chose this particular type of map and the process of creating it. I also provided a brief analysis of interesting findings from the map, such as the concentration of apprentices in major cities compared to rural areas, the higher number of apprentices in the southern region compared to the northern region, and the prevalence of apprentices from churches in urban areas of London. By clearly presenting this information, the audience was deeply engaged with our report and provided valuable suggestions. Some of the suggestions included overlaying other maps, such as water resources, and creating time-lapse maps to showcase changes in the origins of the apprentices over time.
In addition to improving my public speaking skills, I also greatly benefited from the interactions with esteemed academics during the congress. The exchange of ideas and discussions enriched my understanding of the subject matter and provided valuable insights for future research.


For more relevant resources, please click on the links above.
(Note: Please note that Professor Harvey Quamen is the primary author of the report. it is necessary to contact Professor Quamen for potential references or other permissions.)
Continuing Growth...
Through this project, I honed my skills in utilizing Excel and other tools for data manipulation and analysis. I became proficient in tasks such as data cleaning, organizing and structuring data, and creating meaningful connections between individuals through unique identifiers. This experience has been instrumental in improving my ability to handle and analyze data effectively.
By utilizing both mapping platforms and network analysis tools, I was able to enhance the visual representation of the data and uncover additional layers of information. These contributions added depth and richness to the overall findings of the project.
Furthermore, I would like to highlight that working alongside my supervisor, Harvey, provided me with valuable insights into his coding expertise and perspectives, which greatly inspired me. Additionally, collaborating with my peer, Zelin, allowed me to develop invaluable communication and teamwork skills.
In conclusion, this project enriched my technical skills on top of the academic research part, providing a solid foundation for future endeavors in data learning and work.
bottom of page
